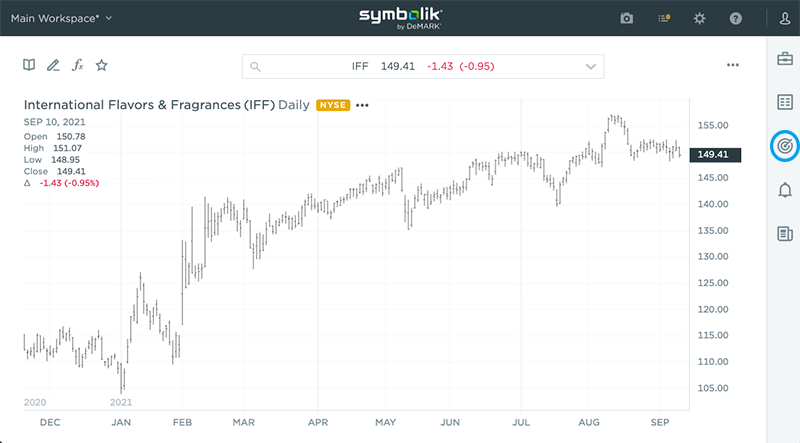
Symbolik provides you with the ability to find stocks that meet certain conditions.
For example, you can see a list of stocks that reached a Sequential Countdown of 13. These lists can be generated daily, or they can be generated on an intraday basis. Lists can be generated using the scanning feature. To access your scans, click on the icon highlighted in the chart below.
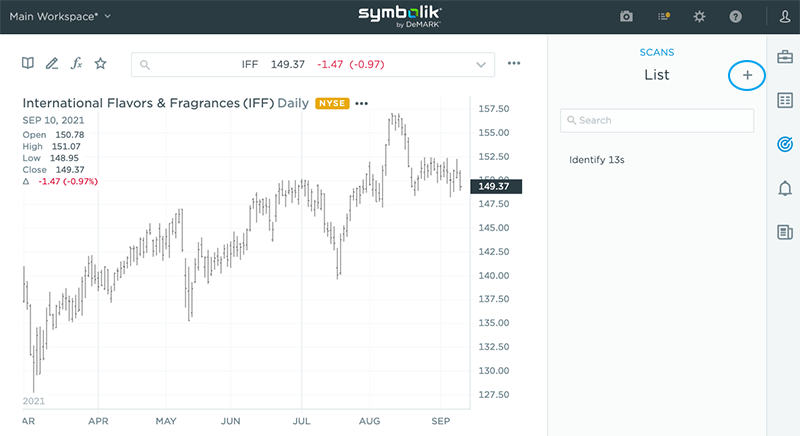
Clicking the ‘+’ icon brings up a screen to create and define a new Scan. After selecting the Scans icon, you will see a screen similar to the chart below. Beneath the search bar is a list of your saved Scans.
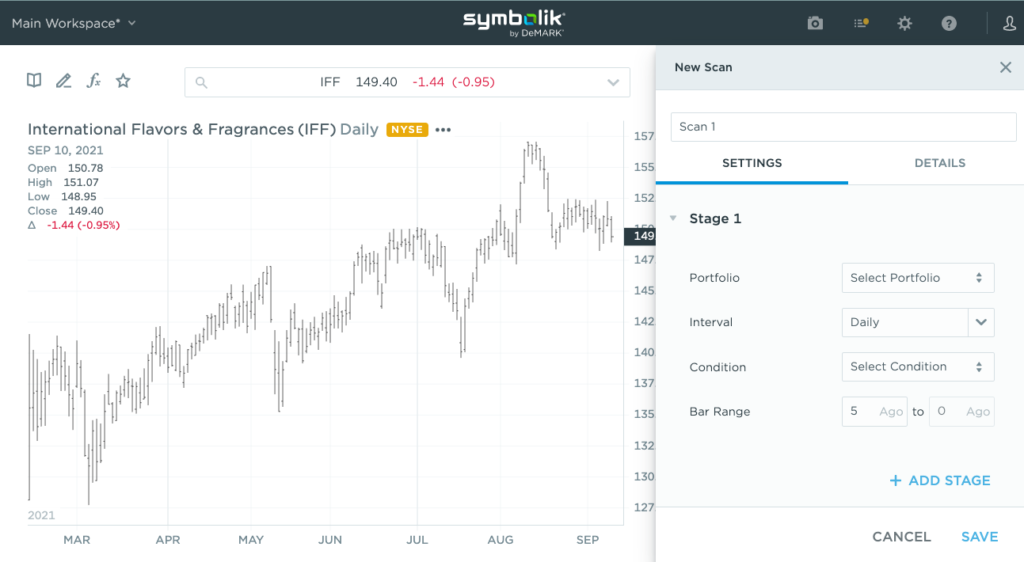
You can name your Scan where “Scan1” appears in the chart above. Scans can be built to run in stages, although only one stage is required.
Select the list of symbols to be used in your scan from the Portfolio dropdown menu. You can use one of the predefined Portfolios, such as the S&P 500, or a custom Portfolio you create.
Next select your Interval, which defines the time frame for your Scan. The default is a daily Scan. The pulldown menu provides access to popular timeframes from 1 minute to 1 year. A custom timeframe can be selected by typing directly into the search bar. For example, typing a comma followed by 8 would create a scan using 8-minute bars.
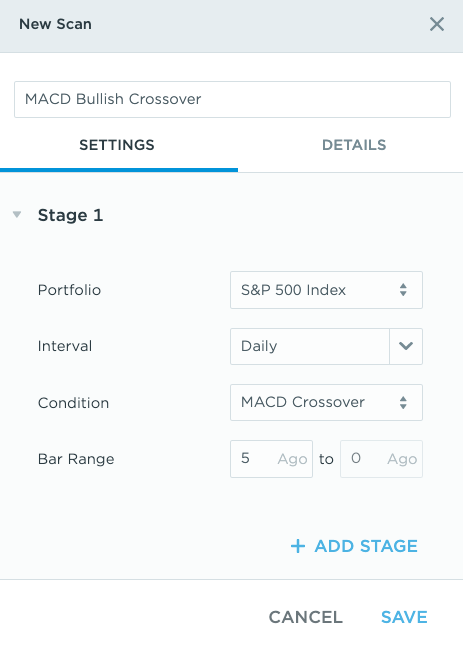
Selecting your Condition will establish the requirements for a positive result. For example, the condition could be a close above a moving average or a bullish MACD crossover. Conditions can be defined before this step or can be added directly during this step by selecting “Create New Condition” from the drop-down menu.
Last, select your Bar Range, which determines how far back the scan will search. The default range is listed as 5 Ago to 0 Ago, meaning the Scan will search for results on each price bar, beginning five bars earlier through the current bar. Symbols are sorted by day.
After saving your Scan, click the “Run Scan” icon that appears on screen. A list of all symbols over the past five days that meet the selected Condition will appear.
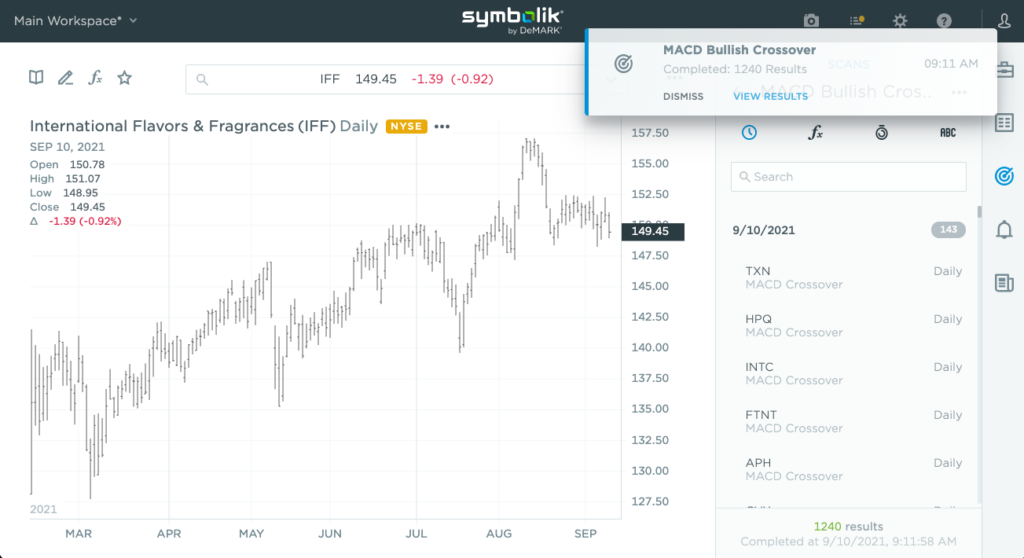
Clicking on a symbol within the results will load the corresponding chart.
Scans are just one of the powerful features in Symbolik that make your trading process easier.
Condition used in this scan:
MACD.Preset1.Diff[0] > 0 AND MACD.Preset1.Diff[-1] < 0